Category Archives: Company News
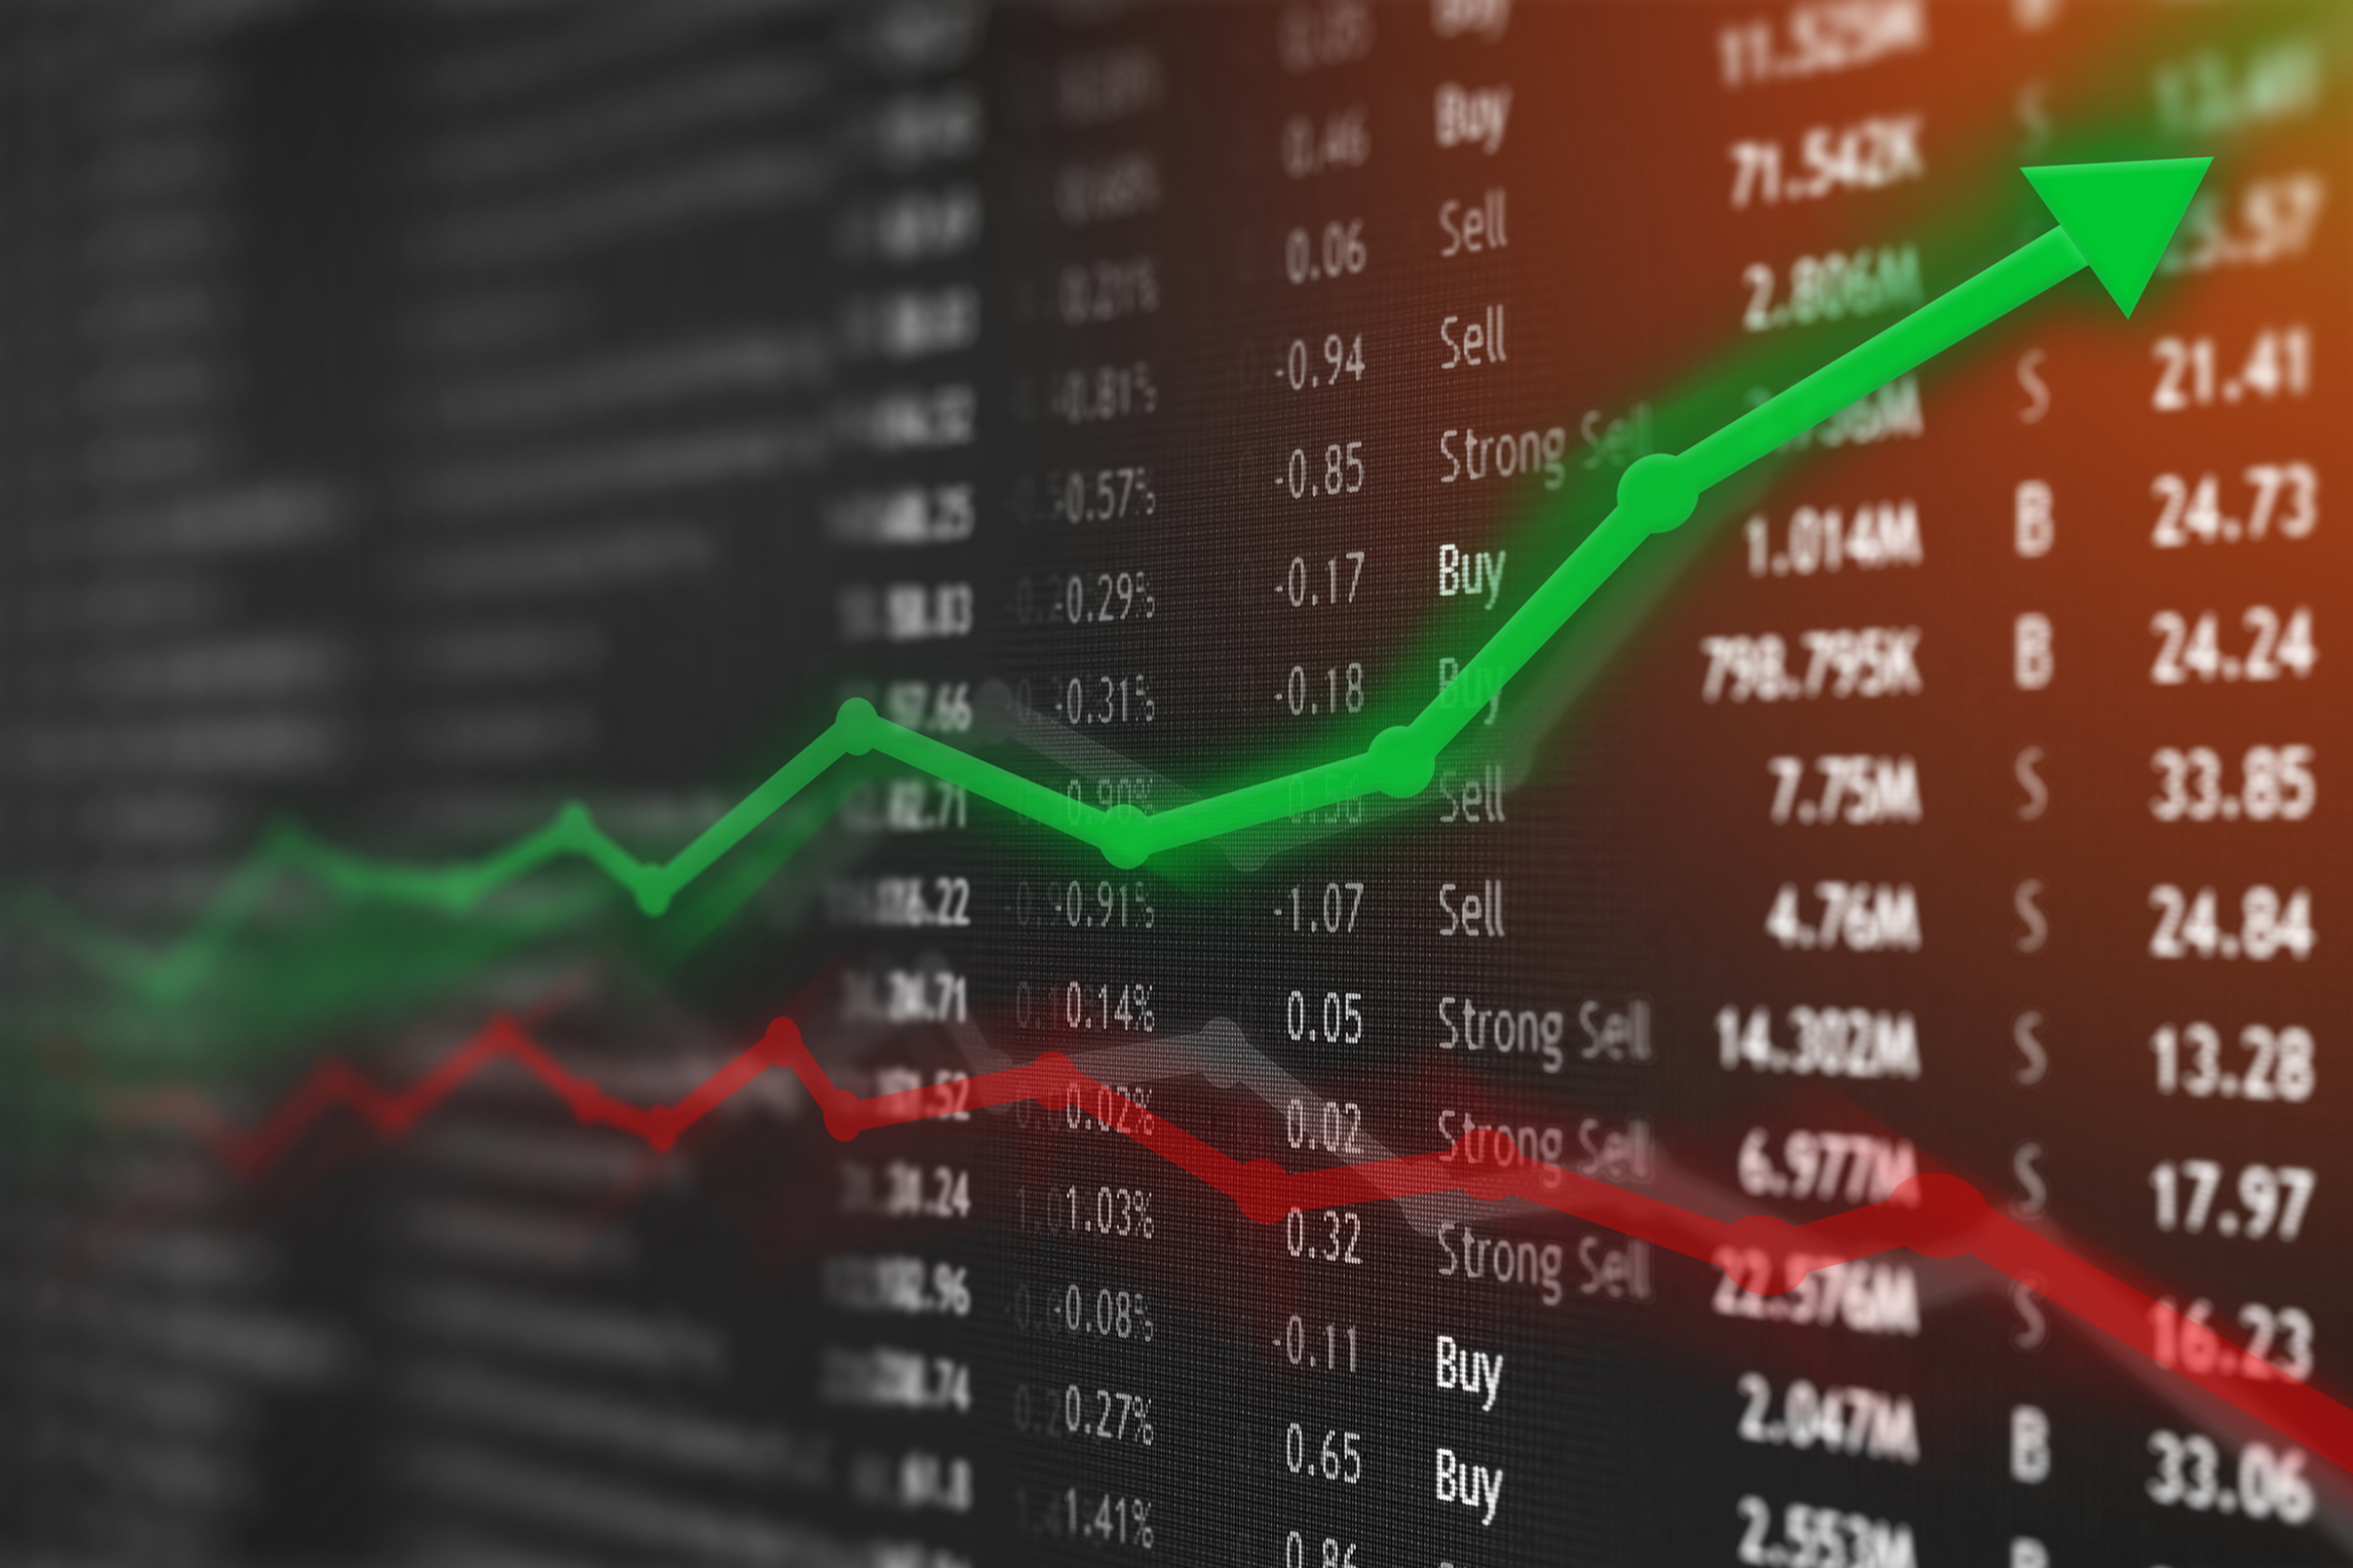
Stocks Drop as Interest Rates Skyrocket
February came and went with such velocity, investors were left on the sidelines scratching their heads “wondering what just happened?” The month started with such strong advances, I began to wonder if we would be able to get through the month with strong returns and escape the typically weak performance record of February. We continued to touch and surpass new market highs in the S&P 500 through mid-month. However, the last week of February saw significant downward price pressure and by the end of the month the S&P 500 had given up nearly all its gains.
This time the catalyst was seeing 10-year treasury numbers unexpectedly spike to a one year high of 1.61%. This spooked investors, who have been eyeing the rise in interest rates as a possible hindrance to the recovery and deviation from last year’s ultra-low borrowing costs backdrop. On the exterior, one would think this does not come close to competing with stocks in a major way, as the average yield on equities is about 2%. However, given that the low in the yield of the Treasury-10 over the past year has been 0.40%, seeing yield triple considered to be cause for concern.
The ramifications of higher interest rates apply to nearly every aspect of the economy. As rates rise, so does the rates on credit cards, mortgages, auto loans, business loans, and so on. As the cost to borrow goes up, corporate profitability goes down. As inflation increases, these costs will have to be passed along to cash-strapped consumers or absorbed by companies with already razor-thin margins in many cases. This is troubling in any economic environment, but it is particularly concerning when we are seeing most areas of the market to be trading extremely elevated from their long-term moving averages. In short, stocks are overpriced over most indexes and investor now must grapple with it becoming more expensive for businesses to borrow money and operate. The Federal Reserve indicated last week they do intend to keep interest rates low for the foreseeable future, which helped to calm some of the volatility.
Technology was the hardest sector hit as it has been trading nearly three standard deviations above its mean. The NASDAQ fell nearly 5% in five trading days. This was lead by declines in areas like Tesla, Apple, and Amazon. However, as we saw a swift rotation out of technology to more “value” areas this does not necessarily mean that technology is “out”. Relative strength in the technology sector remains strong. Tech also ranks third out of all sectors and has a significant lead over the fourth area. As we have seen technology just continue to skyrocket, we have been watching for a short-term pullback to occur. As I always say, stocks cannot just go straight up forever. A healthy market requires periods of cooling down in order to allow those areas to continue to advance to new highs. So for now, we will just watch to see if this is just a temporary and necessary cooling off or a start to something more permanent and we will act in accordance either way.
Navigating markets while they are making significant swings in either direction can be challenging and even scary at times. If you have questions about your current investment strategy, you can always give us a call. We are happy to help. ashleyr@victoryfiduciary.com
 Ashley Rosser, President
Prior to her career in the financial services industry, Ashley earned her Bachelor of Science in Nursing from Cedarville University.
Ashley decided to make a career change from her ten years within the healthcare industry as a pediatric emergency room nurse to retirement and 401K investment planning. She joined Victory Wealth Partners in 2008 after obtaining her Series 65 professional financial license and went on to earn her AIF (Accredited Investment Fiduciary) professional designation from the Center for Fiduciary Studies.
Understanding GME, AMC and the Short Squeeze
It has been an interesting start to the 2021 market environment. Everyone has developed an interest in investing. In case you somehow missed the news, individual investors have been in a purchasing frenzy trying to cause a “short squeeze” among highly shorted companies in the stock market. Institutional investors and hedge funds will “short” a company that they believe will be worth less in the future. For example, Company A’s shares are currently worth $100 each. The short-seller may decide to borrow 10 shares from their lender or broker, and then sell them. 100 x 10 = $1,000. If the investor is correct and X’s shares decrease to $80 then the “short” worked. The short-seller buys back the shares and gets to keep the spread which is $20 per share.
It does not always work out this way however. This short-seller might have been wrong, and instead a big week for Company A causes the shares to increase to $110. Now concerned that the shares will continue to rise, the short-seller decides to purchase the shares back before he incurs any more losses. Instead of multiplying a profit of $20 by 10 shares, they are multiplying a loss of $10 increase in price by 10 shares they must repay. Their loss is $100.
The GME Short Squeeze Phenomenon
Now let’s discuss what has been happening in the market since last week. Highly shorted stocks like GameStop and AMC were being significantly driven upwards by online investing groups encouraging others to “short squeeze” Wall Street. As investors continued to buy shares and skyrocket prices, hedge funds helped prices continue to surge as they had to scramble and cover their “shorts” by buying back their borrowed shares. Hedge funds literally lost billions overnight and individual investors made millions collectively. It was quite the David and Goliath story and it got the attention of even non-investors. The issue is that this is not a long-term phenomenon and eventually the demand for these stocks will dry up as the buying slows. GameStop was trading over $450 at its peak last week, despite trading near $30 for the past year. No one believed the stock was now fairly valued at $450, but rather the price was manipulated in the short term. People are willing to significantly overpay for GameStop because they believe they will be able to still sell it for higher in the future. The issue is what happens when there are no longer any more buyers willing to pay. It will become almost impossible to sell at a premium. Remember, the stock market is merely a place to bring buyers and sellers together. It is driven completely by supply and demand. When the mania dies down and someone yells “fire” in the theater, there will not be enough exits for those trying to leave.
The latest market movements in stocks like GameStop and AMC has been fascinating to observe. But I would be remiss to not also mention that the latest actions also have me concerned. Investors seem to continue to exhibit increased greed and exuberance when it comes to their stock market attitudes and actions. Just as we saw in the early 1990s and again in the early 2000s, investors seem to think the market is nothing but a casino. There seems to be a reckless attitude towards investing and the consensus is that “investing is just too easy”. That is usually about the time that investors are reminded there are two sides to the stock market. The fact is, that while investing using a disciplined approach can absolutely help investors acquire a great deal of wealth, the flip side is that careless investing always ends poorly for investors eventually. Everyone always hopes, “this time will be different.” but the reality is it never is. If you have questions about your current investment management strategy, please do not hesitate to reach out. We would love to help.
Ashley Rosser, President
Prior to her career in the financial services industry, Ashley earned her Bachelor of Science in Nursing from Cedarville University.
Ashley decided to make a career change from her ten years within the healthcare industry as a pediatric emergency room nurse to retirement and 401K investment planning. She joined Victory Wealth Partners in 2008 after obtaining her Series 65 professional financial license and went on to earn her AIF (Accredited Investment Fiduciary) professional designation from the Center for Fiduciary Studies.

Predicting Stock Market Performance for a New Year
The old January adage says “So goes the week, so goes the month, so goes the year” when looking at predicting stock market performance for a new year. The first few days of 2021 have been choppy so far. This trend will likely continue as the market and the world continues to adjust to the dreaded “new normal” we find ourselves in.
As we look at market performance in general, they remain extremely deviated from their long-term moving averages. For now, buyers continue to be comfortable paying premium prices for stocks. This trend will continue until this is no longer the case. I know it seems like an oversimplified explanation but it always comes down to supply and demand. If there are buyers willing to pay, prices can rise. The problem is that while market performance is already trading at 36x times earnings, it is becoming increasingly difficult to justify overpaying for earnings. Eventually, corporate earnings are going to have to markedly improve, or prices will have to revert back closer to their means. When that happens, it is usually swift and unexpected. Remember February 2020? A mean reversion event usually happens when markets are extremely over extended and then experience an unexpected exogenous event. What causes the event? Unfortunately, no one ever knows what it will be which is why markets get caught off guard.
This leaves advisors in a tough place. We are hired by clients to find the best market performance. As we have seen many times, markets can run extended for a while. They can actually run much longer than we would expect. Therefore, we must find ways to participate in the upside while also preparing that things may change quickly. We do this by using a math and rules-based process that allows us to focus on areas of the market experiencing positive relative strength and momentum. We steer away from the areas that are conversely lagging in relative strength and momentum. This sets us up for the best opportunity to “take what the markets will give us” over the long run. We are currently fully invested to our typical allocations. We have been pleased with how those allocations have performed relative to the broad-based markets and so we will remain in those areas as long as the math and rules support it. We are just also cognizant of the need to remain vigilant to the process as momentum and relative strength can and will change over time. When that happens, its important to already know where your next areas of opportunity will be and reallocate accordingly.
We hope (as every one else does) that 2021 proves to be less challenging than its preceding year. Our nation continues to show its ability to overcome and persevere despite significant obstacles and I am confident we will emerge on the other side as a stronger nation. In the meantime, please stay well and if you have questions about your current investment plan please do not hesitate to reach out. We would love to help.
Ashley Rosser, President
Prior to her career in the financial services industry, Ashley earned her Bachelor of Science in Nursing from Cedarville University.
Ashley decided to make a career change from her ten years within the healthcare industry as a pediatric emergency room nurse to retirement and 401K investment planning. She joined Victory Wealth Partners in 2008 after obtaining her Series 65 professional financial license and went on to earn her AIF (Accredited Investment Fiduciary) professional designation from the Center for Fiduciary Studies.

Here Comes the Santa Claus Rally
Here comes the Santa Claus rally? September and October were certainly weak times for the stock market. Both months experienced significant declines from the market highs we saw September 1st. November proved to be a better time for investors as markets saw a boost after the uncertainty of the election passed and it looked like we would have political gridlock. Some find it a surprise that the stock market does better under these circumstances. Markets typically like knowing that neither party will have full control, therefore reducing risk of “radical policy” on either side. From September 1 through October 31 the S&P500 was down over 7.2%. However, the month of November we saw the index move up over 10%. On the first day of December, markets once again saw the market highs that had been eluding investors since September 1st.
So what does this all mean as we head into the last month of 2020? While elevated risk has not left the market completely, we do have all technical indicators giving the green light currently. Our math and rules-based process has allowed us to invest in the strongest areas of the market while also avoiding the weakest areas. In doing so, our models did not experience the same drawdowns the broad markets did in early fall. We have been using the corrections in September and October to add to our equity positions in our portfolios. Over the past 3 months, these equity positions have all been outperforming their indexes by at least double, and in some instances, they have even quadrupled the market’s returns. Short term risks to the market include the annual distributions that mutual fund managers will be making in the next two weeks. Managers have the lowest amount of cash on hand in history, meaning they will need to sell in order to meet obligations. Pension funds are also about to rebalance portfolios and therefore we can expect short term price downward pressure.
Once we get through the first two weeks in December, typically the market has a strong finish to the year. Some refer to it as Santa Claus rally”. Considering it is 2020, “typical” does not usually apply so we will just have to see how the last few weeks finish. Markets remain significantly extended from their long-term moving averages. In order to resolve this, it means there will either need to be a price reversion or stocks will need to trade sideways for awhile to burn off the excess. Broad based markets are still significantly detached from corporate earnings. As we have seen, they can run detached for a significant time but they will always eventually need to reconcile. For now, we will continue to use our process to find those areas of the market that will offer us the best opportunities.
It is hard to believe that the next time I write to you, it will be 2021. As I sat writing a blog 12 months ago, I could not have imagined all that we would experience in a short period of time. We have evolved as an advisory firm even over this past year. One of the “positives” of this past year is we began hosting a weekly video series to update investors with what is happening in the market and what steps we should be considering as a result. It became much bigger than we expected and are looking forward to additional expansions of our videos very soon. We would love for you to follow us every Wednesday on FB or youtube.
Watch Our Most Recent Video
I can answer any questions for you, please do not hesitate to reach out to me. I am happy to help however I can. As I close out my last blog for 2020, I would like to wish you and your family continued safety, health, a very Merry Christmas, and a Happy New Year!
Ashley Rosser, President
Prior to her career in the financial services industry, Ashley earned her Bachelor of Science in Nursing from Cedarville University.
Ashley decided to make a career change from her ten years within the healthcare industry as a pediatric emergency room nurse to retirement and 401K investment planning. She joined Victory Wealth Partners in 2008 after obtaining her Series 65 professional financial license and went on to earn her AIF (Accredited Investment Fiduciary) professional designation from the Center for Fiduciary Studies.

Election 2020 – The Day After
It is the morning after the 45th Presidential Election and like most of you I am here scratching my head at “what comes next”. We anticipated this would likely be an election like never before and so far it is living up to expectations. It could certainly be days before we have certain outcome. We saw the broad-based markets pull back again through most of the month of October, likely in anticipation of a complicated election decision. If you have been following along with my videos you have heard me mention that markets tend to not actually care who becomes president. They can quickly price in policy changes and adjust. What markets do not like however is uncertainty. Going back to 2000 we can see how markets reacted last time we experienced a contested election. Markets fell over 7% during the time between the election and December 13th when the Supreme Court declared George Bush the winner. Therefore, it is fascinating to me to see markets having such a positive surge today despite increasing uncertainties about our election results. 2020 continues to live up to that now despised word “unprecedented”. It was also interesting to see significant money quickly move back into technology overnight. We had seen big tech come under selling pressure over the past two months. Many analysts thought that may have pointed to the market predicting that Joe Biden would win as there were positive flows into areas that would do well if there were hefty stimulus packages passed. As technology futures began seeing huge inflows last night, some wondered if this meant investors were “shifting their bets” that Donald Trump would win. The outcome remains anyone’s guess but the market movements have been fascinating to watch.
What should investors do in spite of all this “noise” we currently have? Now more than ever it is so important to make sure you are following a rules-based approach to your investments. Using emotion to guide your actions will almost always work out against you. When math and rules are your driving force, it tends to help you see through the static even if it does not always “feel right”. We let our winners run and cut our losers quick. If your positions are not working now, they probably won’t work later. Using relative strength allows us to concentrate on areas of the market that are strong and avoid areas of weakness that become drags on performance. It is also important to understand how much risk and volatility is present in your portfolio. If you were uncomfortable during the pullback in September and October, you may want to consider adding a few “hedge” positions to alleviate some volatility. By being invested in the strongest areas of the market, our models have tracked the broad-based indexes closely while still holding a significant portion of fixed income and cash. We will likely be adding additional equity positions very shortly. The technicals tell us when to add positions and where to add them to. This means that the ultimate election outcome will not affect our decisions because the math and rules are always guiding our next steps. I know these remain uncertain times for so many investors and if you have any questions, I would be happy to help however I can. Feel free to call or email me. Have a great day!
Ashley Rosser, President
Prior to her career in the financial services industry, Ashley earned her Bachelor of Science in Nursing from Cedarville University.
Ashley decided to make a career change from her ten years within the healthcare industry as a pediatric emergency room nurse to retirement and 401K investment planning. She joined Victory Wealth Partners in 2008 after obtaining her Series 65 professional financial license and went on to earn her AIF (Accredited Investment Fiduciary) professional designation from the Center for Fiduciary Studies.

Markets Face Headwinds Headed Into October
Markets face headwinds rather than tailwinds headed into October. September was ripe for a sell off. We had been warning that the signs were all there of a market that was overstretched, overvalued, and overdue for a pullback. The S&P 500 was trading two standard deviations above its moving averages. As a reminder, moving averages act like a magnet pulling markets towards them when they trade too far above or below them. The further away they move, the swifter (and more painful) a reversion can be. For example, during this current correction the NASDAQ was down over 12%. While the sell-off was not unexpected, it still caught investors off guard who had become accustomed to the market “only going up”.
So here we are on the last day of September and you may be asking your self “what now”? We have seen the market have a “reflexive rally” in the past few days. This is not surprising either as the markets are all relatively oversold on the short term. It is important to make mention that despite the recent advances, we have been unable to break through the 50 day moving average above us. This points to possible additional selling pressure for the markets. If we are unable to break above the 50 day, it is possible to see a retracement down to the 200 day moving average, or an additional 7.2% decline.
Markets face headwinds rather than tailwinds currently. It appears likely that any additional stimulus program will not be passed, at least not until after the election. The stock market was counting on more stimulus and economic recovery indicators have begun to shift disappointedly as the extra stimulus has now gone dry. The Federal Reserve also made it clear that we should not expect new aggressive intervention from them for now. They have punted the football back to congress, saying it is now in their court to pass a new program. This will likely further concern markets. We are also still dealing with the effects of COVID-19, and the uncertainty of what the winter months may bring in terms of resurgences. We remain in an economic recession and corporate earnings continue to dip. 2021 S&P 500 earnings estimates are down nearly $30 per share since the original estimates made in January 2020. Did I mention we have a presidential election coming up?
With all the headwinds we see, as well as the fact that markets are still very overvalued when compared to longer term means we think investors should remain cautious for now. If you were uncomfortable during this current pullback, you may be taking more risk than necessary. You could consider using any short-term rallies to rebalance your portfolio and adding in some defensive positions until the rest of the headwinds have cleared. I am not suggesting you need to sell all your equity positions, just consider trimming them temporarily. We remain invested and our tactical allocations have continued to perform very well compared to the major indexes. The power in using relative strength and positive momentum to choose allocations means we do not have to take on more risk than we are comfortable with. It also allows us to choose areas that are performing strongly, while excluding the laggards that wind up being drags on performance.
There is no crystal ball when it comes to investing. However, we think investing using emotions, hope, and feelings are not a good strategy. That’s why we rely on math and rules. If you have any questions, you can always email me at ashleyr@victoryfiduciary.com. I am happy to help any way I can. Have a great month!
Ashley Rosser, President
Prior to her career in the financial services industry, Ashley earned her Bachelor of Science in Nursing from Cedarville University.
Ashley decided to make a career change from her ten years within the healthcare industry as a pediatric emergency room nurse to retirement and 401K investment planning. She joined Victory Wealth Partners in 2008 after obtaining her Series 65 professional financial license and went on to earn her AIF (Accredited Investment Fiduciary) professional designation from the Center for Fiduciary Studies.

Tread Carefully in Today’s Market Climate
It has been an interesting month for the stock market so far, especially considering we are only nine days in. We have seen a significant increase in volatility as compared with August. In general September tends to be a weaker month for the market, even without a weak economic backdrop. You may recall last month I discussed the importance of paying attention to the technical moving averages for the market. Moving averages act like a magnet, pulling markets back to them when they become grossly disconnected.
Last Wednesday, during my Midweek Market update I sounded the alarm that the NASDAQ was trading two standard deviations above its moving averages and that a pullback would be unavoidable. We were just too extended for it to be sustainable. The S&P 500 was also trading significantly above its averages, just not quite to the extent of the NASDAQ. The next day we began to experience a significant selloff across the market over the next three trading days. As of Tuesday’s close, the NASDAQ was down 10% and the S&P 500 was down 7%. Most importantly, both indexes are now sitting directly on their 50 day moving average. It is a good reminder that technicals really do matter in the stock market, even if emotional exuberance seems to say otherwise.
The level of greed and speculation occurring in the market makes some advisors have flashbacks to what happened back in the late 90s. Knowing what happened then and is happening now makes me uncomfortable. It feels like history is repeating itself in some ways. Markets remain extremely overvalued at the same time our country is experiencing significant economic weakness. Investor sentiment seems to be “the market can only go higher”. Call options are at all time highs, meaning that investors are “betting” that the market will go higher and not using any type of hedge in their portfolios against downside risk. Many were caught off guard these past few days as markets sold off quickly. Sadly, many inexperienced investors found out that trading options without understanding risk can sometimes turn around and bite you fast. It is important to understand that markets could absolutely turn lower, an additional correction of 10% would not be out of the question.
So what should investors do now? On Wednesday, the market was experiencing a bit of a reflexive rally, which is expected after such a sharp pullback. The question many ask is should I buy stocks now or should I wait? There is fine line between “buying the dip” and “trying to catch a falling knife”. As an investment committee we are concerned about technical data that indicates there could be some additional headwinds for the market, at least in the short term. So in short, we continue to tread carefully. Our five equity positions continue to perform strongly, outpacing the indexes. They also held up remarkably well over this past pullback, further reinforcing why using relative strength to choose your investments can help you outperform the markets. We will be adjusting our current allocations and adding asset classes once we have confirmation that this pullback is complete. We just do not want to try to handle this pullback like a teddy bear, and then find out it is actually a porcupine. As always, please reach out to me if you have any questions. I would love to talk to you. Have a wonderful day.
Ashley Rosser, President
Prior to her career in the financial services industry, Ashley earned her Bachelor of Science in Nursing from Cedarville University.
Ashley decided to make a career change from her ten years within the healthcare industry as a pediatric emergency room nurse to retirement and 401K investment planning. She joined Victory Wealth Partners in 2008 after obtaining her Series 65 professional financial license and went on to earn her AIF (Accredited Investment Fiduciary) professional designation from the Center for Fiduciary Studies.

Lighthouse or Barge
I know it has only been a month since I last wrote but it sure feels like it has been a year. I struggled to summarize all the actions and updates we have seen in the past four weeks. The stock market continues to surprise us, sometimes even with significant swings in the same trading day. As I sat writing this, the Dow Jones Industrial Average was trading up about 1.4%. I took a short break 45 minutes later and to my surprise saw that it was now down -.4%. That is over a 400 point reversion in under an hour and speaks to the continued volatility and uncertainty we are seeing day to day within the market.
If you have been following along with me for the past few months, you know our firm has been extremely concerned about the current market environment. Stocks in the S&P 500 are currently trading using 26X earnings. The typical ratio is 16.5 and it means that the market is significantly disconnected from corporate earnings. It does seem that the market is saying that valuations are not important. However, if our recovery continues to slow, and employment and wages continue to worsen, they will. The current extremes shown between market and corporate profit deviations should be sounding alarms.
Speaking of deviations, the NASDAQ is current trading 23% above its 200 moving day average. Averages work as a gravitational pull to bring prices closer in line to it. That is the way averages work. The further extended a stock gets from its moving average, the more likely the pullback will be significant. I use the analogy it is like a rubber band being stretched and stretched, eventually it will be unable to be stretched any further and it will snap back as far as it was originally pulled.
The significant concentration amongst the major indexes points to increasing weakness in the market. Currently over 26% of the S&P 500 return year to date is a result of Apple, Amazon, Google, Facebook and Microsoft. Additionally, if we look at market capitalization those same five companies make up the same amount as the bottom 394 companies in the index. These are staggering numbers that point to the overall weakness, despite the recovery we have seen.
The Federal Reserve has undoubtedly assisted with “helping” the market by injecting massive amounts of liquidity in March and April. I say “helping” because what we are now left with are waters that are foggy and difficult to navigate because many numbers have become skewed. It is now tough to see if the light we see in the distance is the safety of the lighthouse or a runaway barge that is heading straight towards us. The math and rules tell us that we are not out of danger and we should continue to move methodically.
We did take three minority equity positions last month using our math and rules-based process. We tactically chose areas in consumer cyclicals, industrials, and online retail as they show great opportunity based upon their relative strength and momentum. We also steered clear of areas with decreasing relative strength and momentum as they will typically become drags on performance. We are still avoiding areas that are heavily weighted in the major indexes as we see the elevated risks outlined above. Since taking our three positions, they have collectively seen returns of 9.85% compared with S&P500 return of 3.86% over the same time period. This is the advantage of using a tactical approach that uses math to make investment decisions.
As more of the fog continues to clear, we will continue to take new equity positions. We continue to be aware of the increased risk within the markets and will manage our portfolios accordingly. Market greed is at all- time highs, investor sentiment is that “stocks can only go higher” and put- to- call ratios are extremely low. These are typically seen right before markets see a top. I am not saying that the market cannot go higher in the short term. But I am saying it would not be prudent to ignore all the headwinds and risks that currently exist for the market. Complacency, especially during market tops always wind up being detrimental. We need to know if the distant light we see is coming from the safety of the lighthouse or from the runaway barge heading straight for us. My job as an advisor is to protect my client’s principal, reduce risk, create wealth, and avoid being capsized by the unexpected barge: all at the same time.
Best
Ashley Rosser AIF BSN

When the Facts Change
Renown economist John Maynard Keynes is commonly accredited with saying, “when the facts change, I change my mind.” In the spirit of this mindset, we would like to take a second to discuss some key facts we are observing in the stock market today that are devoid of emotions like fear or hope that dominate today’s headlines.
The first analysis we will do is looking under the hood of some of the major indices that have outperformed so far this year. Of the three major indices, the Nasdaq 100 Index has far and away been the outperformer so far this year. The Nasdaq 100 is an index of 100 of the largest, most actively traded U.S companies listed on the Nasdaq Stock Exchange. When looking under the hood, however, the makeup of its performance so far this year is concerning. The top five companies in the Nasdaq 100 are megacap companies that should be familiar: Apple, Microsoft, Amazon, Google, and Facebook. As of last Monday’s (July 13th) close, these five companies make up over 77% of the Nasdaq 100’s return year-to-date (YCharts). For comparison, these five companies only make up around 46% of the index’s holdings. When an index’s performance is so heavily concentrated in a select group of stocks, it typically is not indicative of a healthy market environment. In the same way you would diversify your own investments, having such narrow leadership in an index can spell trouble when and if those leaders begin to lose steam.
In the same way the Nasdaq 100 has narrow leadership, both the cap-weighted S&P 500 technology and consumer discretionary indices have seen megacaps skew their performance. As a refresher, a cap-weighted index is an index that bases the size of each holding off their market capitalization (stock price times the number of shares outstanding). Currently, Microsoft and Apple make up just under 44% of the cap-weighted technology index, yet they make up over 86% of the index’s performance year-to-date (YCharts). Likewise, Amazon makes up nearly 26% of the cap-weighted consumer discretionary index. Amazon’s weighted performance means that it currently makes up 17.6% of the index’s 4.9% return year-to-date, meaning that the other holdings are accounting for a return of -12.7%. With heavy concentration like this, it’s not surprising that the dispersion between the cap-weighted sectors and the equal-weight sectors is abnormally high. Over the previous five years, the average outperformance by the cap-weighted technology sector versus the equal-weight technology sector was around 1.8%; this year, it has outperformed the equal-weight technology index by over 15%. Similarly, the average outperformance by the cap-weighted consumer discretionary index over the past five years has been 6.5%; this year, it has outperformed its equal-weight counterpart by nearly 33%! Just like the Nasdaq 100, even certain sectors with exposure to these megacap leaders are top-heavy to say the least.
Another way to observe narrowing leadership is to review the top five holdings of the S&P 500 relative to history. Currently the top five holdings in the S&P 500 make up over 25% of the index. For comparison’s sake, the top five made up just over 17% of the index at the end of 2019. When you see the concentration of the top five holdings spike like this, it is usually due to three possibilities: the top five are way outperforming the rest of the index and increasing their size, the rest of the index is doing poorly relative to the larger names, or both possibilities occurring at the same time. In today’s environment, it appears that both are happening; while the megacaps continue to outperform, the rest of the index continues to lag considerably behind them. It is worth noting that not only is this the largest concentration for the top five stocks since 1964, but it is also the largest year-over-year increase since the jump from 1998 to 1999 during the Dot-Com Bubble (S&P). While there is no guarantee that we are on a collision course with a similar crash of that magnitude, it is worth keeping an eye on this group.
The last fact we would like to mention is the current valuation of the market. The Buffet Indicator, a valuation indicator coined by Warren Buffet, observes the Wilshire Total Stock Market Index (a cap-weighted index of over 3,400 U.S. companies) versus U.S. GDP. Today this valuation indicator sits not only just below its historical high but is even higher than its peak during the Dot-Com Bubble. In short, the Buffet Indicator currently says that the market today is severely and historically overvalued relative to the fundamentals of our economy.
While it can be confusing to see market indices rise when it seems the rest of the economy is doing poorly, we thought it would be best to provide some insight into what is actually driving these indices. Narrow leadership in the megacaps can seemingly keep things afloat, but the risk of these losing steam and joining the rest of the laggards in the index causes us to continue to remain cautious; the market is going to need greater participation in all areas before this can be considered a healthy market environment. We will continue to monitor the economy and the markets on both the fundamental and technical sides, and we will be sure to notify you of any material changes we observe. In the meantime, don’t hesitate to reach out if you have any questions or concerns. Join Ashley every Wednesday as she provides her Mid Week Market Update video on both our Youtube and Facbook pages.
Be Well,
Ashley Rosser AIF, BSN
The opinions voiced in this material are for general information only and are not intended to provide specific advice or recommendations for any individual. All performance referenced is historical and is no guarantee of future results. All indices are unmanaged and not be invested into directly. The Standard & Poor’s 500 Index is a capitalization-weighted index of 500 stocks designed to measure performance of the broad domestic economy through changes in the aggregate market value of 500 stocks representing all major industries.

Independence Day Edition of Mullica Hill Money Matters
Welcome to the Independence Day edition of Mullica Hill Money Matters. Its hard to believe we are entering into the first week of July. I think it is also hard to believe how different life remains just a few short months after we first heard the words “Corona Virus”. In true American spirit, I have been proud and encouraged watching how so many have persevered to make the best of a very tough situation. It is that unique perseverance that will allow America to come out on the other side of this current battle victorious.
However, I think it is fair to say that the next few months will likely have a few unexpected fireworks explosions to our economic recovery and investors should be prepared for what this could potentially mean in both the short and intermediate term.
Follow us on Facebook and check in every Wednesday for our latest video.
Our Investment Committee remains cautious regarding our investment allocations. I have said all along that I believed the market has priced in a near perfect recovery that has left no room for disappointment. Last week, as COVID began to surge in states like Florida, California, Texas and Arizona, the market was clearly rattled. Adding an additional concern was seeing states needing to backtrack and even halt their re-opening plans. You see, the market is not concerned with the virus itself but rather how its continued presence will hamper the US economic recovery. On Friday, we watched as the S&P 500 closed below its 200 moving day average. The 200-day SMA, which covers roughly 40 weeks of trading, is commonly used in stock trading to determine the general market trend. If a stock price remains above the 200-day SMA on the daily time frame, the stock is generally considered to be in an overall uptrend. It was able to reclaim its position above on Monday but a second decline below could show signs of increasing weakness of the index. The Dow Jones Index also showed concerning signs of weakness as it closed just a few points above 25,000 with Friday’s sell off. If the economic recovery continues to stall, this will likely disappoint investors.
We also continue in our belief that the market is significantly overvalued compared to its P/E (Price to Earnings) ratios. While it is true that the stock market is not the economy, it is directly tied to corporate earnings. Right now however, the market seems to be detached from this fact. It is interesting that as we went into 2020, the S&P 500 was pricing in earnings at $160 per share. We are currently pricing in earnings of $180 per share. That is a serious disconnect considering what we know about our current earnings. The only way to rectify this will be for earnings to come up or stock valuations to come down. The Atlanta Federal Reserve is estimating Q2 corporate earnings to come in at a historic negative 47%. History shows us that it is always valuations that wind up trending down when the market becomes this disconnected. The S&P 500 is also severely overconcentrated as about 25% of its performance has come from 5 stocks. We have not seen concentrations like this since the 70s and it points to weakness in the rest of the index. The Buffet indicator is currently showing a market overvaluation of 145.7%. The last time stocks were this overvalued was right before the Dot Com Bubble burst. Its no wonder why Warren Buffet is currently sitting on 137 BILLION dollars in cash right now.
Simply put, the market is currently full of greed and emotion. As investment managers, it is important we remain unemotional as we make investment decision for our client. Most investment mistakes happen because we allow our emotions to get in the way. As such, we choose to remain committed to using our math and rules-based process to steer our next steps. Currently, our program continues to recommend using defensive investment allocations. As such, we are using a mix of cash and fixed income options for our individual investors. We will remain there until we are given additional reassurance that the equity market risk no longer out weighs the potential reward. We are interested in investing in the areas of greatest potential, taking risk into account. When our indicators turn, we will concentrate in the areas showing greatest strength while avoiding weaker areas. This allows us to avoid areas that would drag down our performance.
We are looking forward to the coming months as we can hopefully prepare to round the corner of this historic time. We just need to remain prudent and patient as we have concerns there are a few more unexpected fireworks that have yet to appear. As the famous investor Charlie Munger once said, “the big money isn’t in the buying and the selling but the waiting.” Victory Wealth Partners wishes you a very happy Independence Day and continued health and safety for you and your family.
Ashley Rosser, President
Prior to her career in the financial services industry, Ashley earned her Bachelor of Science in Nursing from Cedarville University.
Ashley decided to make a career change from her ten years within the healthcare industry as a pediatric emergency room nurse to retirement and 401K investment planning. She joined Victory Wealth Partners in 2008 after obtaining her Series 65 professional financial license and went on to earn her AIF (Accredited Investment Fiduciary) professional designation from the Center for Fiduciary Studies.