A History of Market Corrections

While the talking heads continue to stoke the flames of hysteria regarding the Novel Coronavirus, we would like to provide a follow-up to our previous article, “Do Global Flus Cause Market Blues”. If you have not read that article yet, we highly suggest you do. We discussed how recent volatility has seemed more pronounced due to an abnormally calm fourth quarter, as well as how the market has reacted to previous epidemics that have had a death toll of at least 100 people. As a recap, the market has averaged positive returns in the 90, 180, and 365-day periods following the initial outbreak, implying that there are other factors that have a much greater impact on the market. This time, however, we would like to discuss a phrase that is thrown around during times of volatility: market corrections.
In the same way a car’s engine can overheat, the stock market can overheat after periods of sustained and, more often than not, rapid growth. At the peak of these growth periods, stocks prices may have even increased faster than their actual underlying value. In these instances, the stock market typically enters a market correction. To put it simply, a market correction is a temporary resetting of market prices. Market corrections typically involve the market falling at least 10%, but they can even fall as much as 20%. In fact, the 2018 correction saw the S&P 500 index fall -19.78%. While no investor wants to see their account down 10%, market corrections are a vital and healthy aspect of our stock market.
As was previously mentioned, market corrections help to prevent the market from becoming egregiously overvalued. Just as the Federal Reserve adjusts interest rates to control inflation, market corrections act as a check on the stock market. While certain asset classes and sectors of the economy can go through isolated corrections, a market correction tends to affect all areas of the market at once. Once the market has seen a broad pullback amongst the sectors of the economy, stocks will once again continue their growth at their newfound prices. In short, market corrections help to ensure our stock market is at a healthy level and valuation.
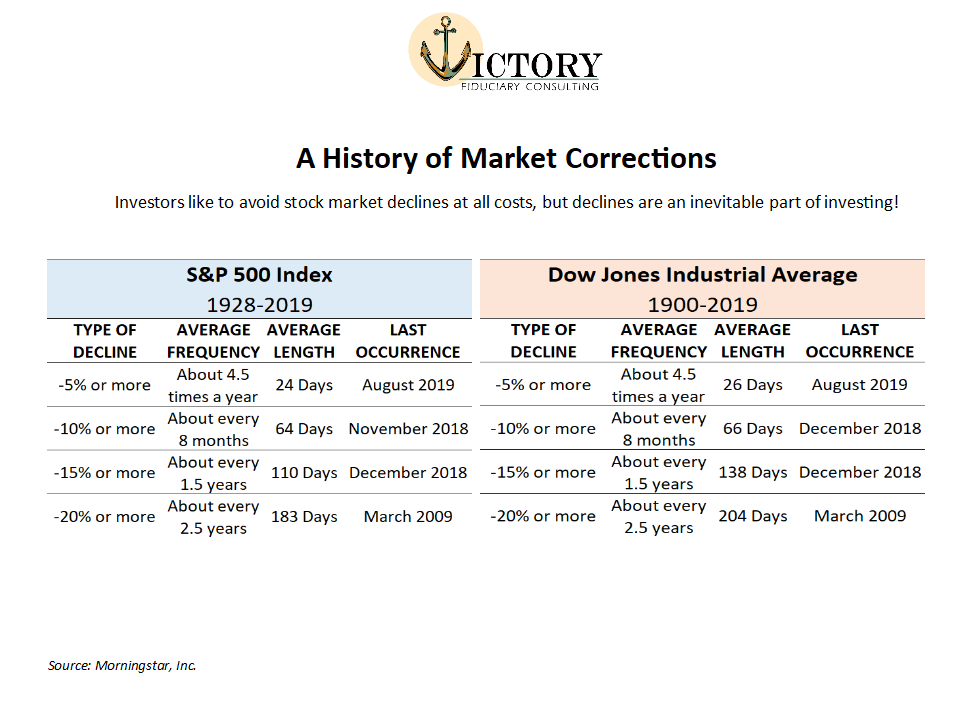
Now that we have a better understanding of what a market correction entails, the next question is: when do they occur? Unfortunately, there is no crystal ball for predicting corrections. However, we can look at history to create realistic expectations of investing. In the two tables at the end of this piece, you will find a table each for the Dow Jones Industrial Average and the S&P 500, the two major U.S indices. The tables look at each index to observe the frequency of market pullbacks through history. In these tables, you will notice that pullbacks in the market are frequent throughout history. In fact, both indices have historically had a 10% or worse correction every 8 months! For perspective, the market has not had a correction of at least 10% since the end of 2018, meaning that, if history is to be our guide, we have been overdue for a correction. As of Thursday’s market close, we have surpassed the 7% pullback for the S&P 500 and 9% for the Dow Jones. While we can’t know for certain whether this will be closer to the pullbacks of the 2018 correction, we know that history shows us that corrections are a natural and relatively frequent occurrence in our markets.
Finally, the burning question on everyone’s mind: what should I do? While it is much easier said than done to stay the course during a correction, it is imperative that we remain diligent and long-term investors. We are reviewing the market and each asset class daily to see if there are any trend changes,
and we will make adjustments as needed. However, our six recession indicators remain positive, just as they did through the 2018 correction. If we observe any changes to these indicators, we’ll be sure to let you know. In the meantime, our best advice is to remain calm and stay informed. We will continue to do our best to provide you with relevant updates and information, but feel free to reach out to us if you have any questions or concerns.
Thank you,
Bud Verfaillie & Ashley Rosser
Victory Wealth Partners
Anchored in Compliance
53 N. Main St
Mullica Hill, NJ 08062
Office: 856-464-3100
The opinions voiced in this material are for general information only and are not intended to provide specific advice or recommendations for any individual. All performance referenced is historical and is no guarantee of future results. All indices are unmanaged and not to be invested into directly.
The Standard & Poor’s 500 Index is a capitalization-weighted index of 500 stocks designed to measure performance of the broad domestic economy through changes in the aggregate market value of 500 stocks representing all major industries. The Dow Jones Industrial Average Index is a price-weighted index of 30 stocks designed to measure performance of the broad domestic economy through changes in the aggregate market value of 30 stocks representing all major industries.